

Presidential Election Polling

November 4, 2020
November 3, 2016. Life is good. I walked into school without a mask. We discussed the upcoming election, still five days away, in Mr. Flower’s eighth grade civics class. The polls have Clinton with a significant lead. The polls were wrong. Trump won with seventy-seven more electoral votes than Clinton in a stunning upset. Dredging up traumatic flashbacks, or reminiscing on fond memories, the 2016 election should be a cautionary tale to anyone following the polls too closely.
The polls were not dead wrong, as many pundits like to say. Aggregating all polls from significant races, presidential, congressional, and gubernatorial, since 2016 it is true that Republicans over performed by 3 percentage points. This isn’t the result of some liberal conspiracy: in 2018 democrats over performed by 2.3 points, and in 2014 republicans over-performed by 2.6. The polls aren’t dead wrong shots in the dark, but instead rough guesses. Since 1998, the average poll error was just six percentage points. Not terribly precise, but still good accuracy. On this day four years ago, the polls had Clinton at 45.0% and Trump at 42.3%. Well within normal polling error. To be perfectly fair, Clinton did beat Trump in the popular vote by 2 percentage points, but the popular vote isn’t what counts. Just as in 2016, Trump has a significant edge in the Electoral College. Five Thirty Eight is giving Trump an eight percent chance of winning the election despite losing the popular vote.
Every four years, the Cub News conducts a poll of our own. In our 2016 poll Clinton, eeked out a victory with the margin of victory being a meager 0.04%. Trump won Michigan by 0.23%, making our polling accurate to roughly one-quarter of a percent, much better than the average of six percentage points. We, like all pollsters, are constantly updating our Thursday methodology. In 2016, many pollsters decided that they needed to weigh non-college-educated voters more in their polling. If we do the same and throw out the members of our school that are college-educated, mostly faculty and staff, we lowered our error to roughly a fifth of a percent.
The race is more than just a numbers game. To truly understand our political landscape, a smaller more dedicated focus group can provide a clear view of the race. Our 2016 focus group had several people say they were voting simply because of dislike of the other candidate. This year, most people emphasized the candidate that they supported instead of negative partisanship. In 2016, Vice President Mike Pence was a boon to the Trump campaign, but this year the vice-presidential candidates were seemingly absent. The only time a vice president was mentioned as one respondent said they were scared Biden would “simply become a puppet of Kamala Harris and the liberal movement”. While in 2016, many viewed Trump’s temperament favorably, now it’s his opponent that people respect more. One person said that the main reason that they support Biden is that
“He presents himself with dignity and respect, the way a president should act.”
The religious right, constant as ever, are still steadfast Trump supporters, but the reasoning is slightly different this time. In 2016, the reasoning was based on policies, against LGTBQ rights or pro-life, without explicitly invoking faith. Religious voters this time around because
“The Republican party Lines [sic] with my traditional Christian values”.
This is much more tenuous support though, with people qualifying their support was “not because I necessarily like him” but out of a belief that “faith is being attacked”.
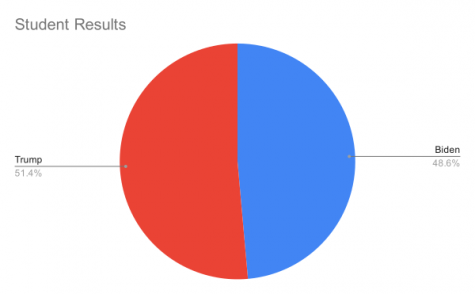
Using our methodology from 2016, we have the polls showing Biden winning by 7 points, not an unreasonable amount but more than average polling error. With our new methodology, Trump eeks out a victory of a little under three points. It probably isn’t accurate to entirely discard college-educated voters, even if doing so makes our 2016 polling posthumously more accurate. Our poll doesn’t give an accurate snapshot of voters, however. Our sample is much younger than the voting population and very geographically limited. Together, this does cast doubt on the accuracy of our results; however, our polling is consistent with larger polls from the state, the best polls have Biden way ahead; the worst polls have a narrow Trump victory.
Five Thirty Eight gives Trump only a 10%chance, and it’s important to remember 10% isn’t zero. In 2016, Trump had a 30% chance of winning, which many people erroneously thought that anything less than fifty meant a sure-fire loss. Trump still has a significant path to a second term, even before considering any drawn-out battles in the court or refusing to abide by-election results.
The polls are in Biden’s favor, but in many swing states, the polls are close enough that a standard polling error could deliver another, albeit with the slimmest of margins, electoral college victory to Trump.![]()
![]()
![]()
![]()
![]()
![]()
![]()
![]()
![]()
![]()
![]()
![]()
![]()
![]()
![]()
![]()
Senior Results: 56% Biden; 44% Trump
Junior Results: 64.1% Trump; 35.9% Biden
Sophomore Results: 53.5% Biden; 46.5% Trump
Freshman Results: 54.2% Trump; 45.8% Biden
Academy Results: 57.1% Biden; 42.9% Trump